
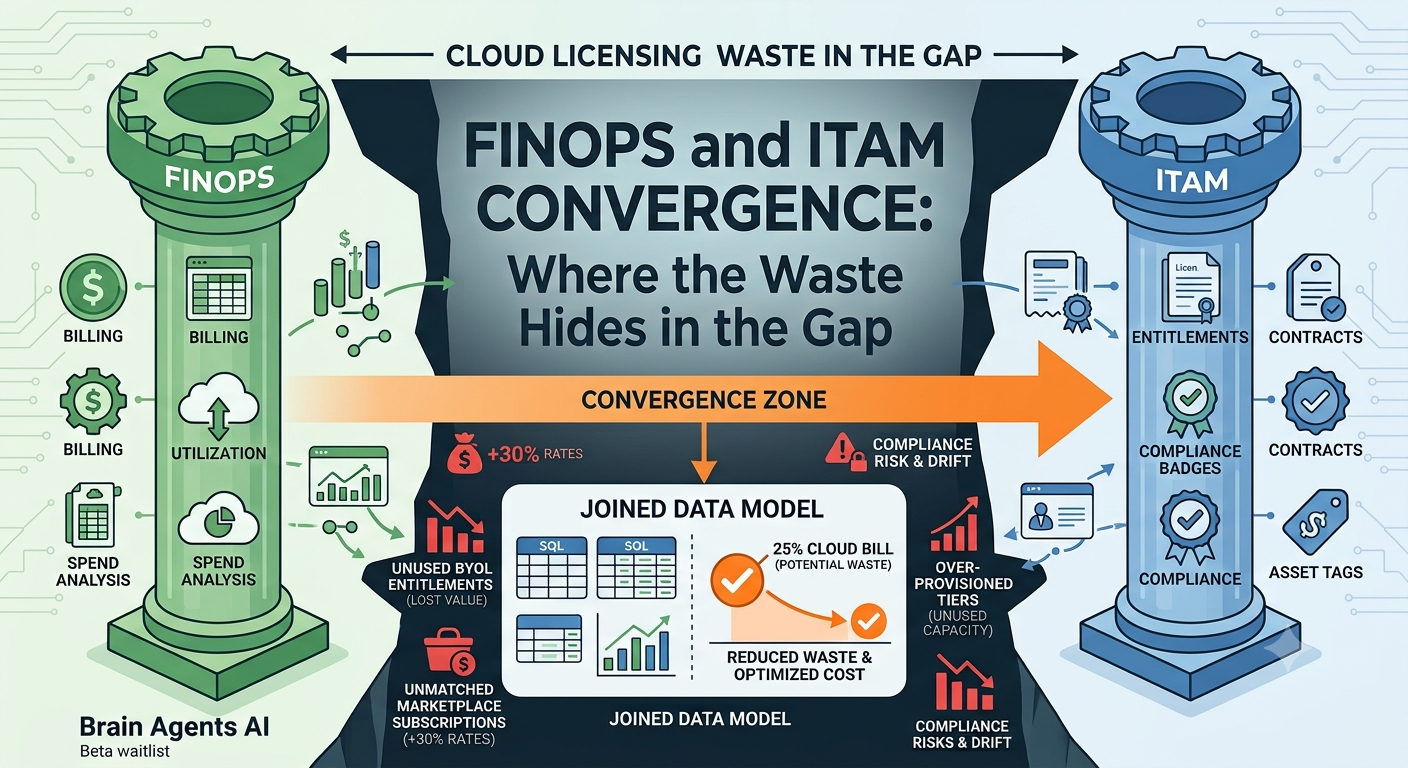
Cloud licensing waste can reach a quarter of the cloud bill, and most of that waste is invisible to FinOps and ITAM working separately. This article walks through where the gap between the two disciplines lives, what specifically hides inside it, why a single-discipline tool cannot close it on its own, and what the joint audit that surfaces the waste looks like. The answer, front-loaded so you can decide whether to keep reading, is that the waste lives in the join between billing data and entitlement data. FinOps has the first. ITAM has the second. Neither one has both. Whichever team builds the joined data model first captures the savings the split model has been leaving on the table for years.
The reason this category deserves an article of its own is that most cloud FinOps writing treats software licensing as a rounding error inside the total cloud bill. The rounding-error framing was fair when cloud workloads were mostly infrastructure and the software running on them was mostly open source. It stopped being fair somewhere around the point when marketplace channels became the primary distribution path for third-party enterprise software into cloud accounts. Today the licensed-software category is a serious line item on any mature bill, the waste inside it is well documented in industry benchmarks, and the intervention is a specific data model that anyone with cross-team air cover can build.
The two disciplines and what each one sees
FinOps is the discipline that reads the cloud bill and asks why it is what it is. The discipline grew up around the cloud billing export as the source of truth. The FOCUS specification is the modern version of that source of truth, normalizing the export into a shape that is consistent across providers. A mature FinOps practice can attribute any line item on the bill to a workload, a team, and a business unit within some latency after the bill closes. The strongest version of the practice adds forecasting, commitment portfolio management, and unit economics to the base attribution.
ITAM is the discipline that manages software as an asset independent of the infrastructure that runs it. ITAM predates cloud by decades. The practice tracks contracts, entitlements, license counts, compliance obligations, and vendor relationships. A mature ITAM practice knows what the company is entitled to, what the company is paying for that entitlement, what the audit exposure looks like, and how to renegotiate at renewal. The strongest version of the practice adds proactive vendor management and portfolio optimization across the software catalog.
The two disciplines were built to answer different questions and they use different data models. FinOps starts from what did we spend. ITAM starts from what do we own. Both questions have been essential to their respective owning functions for as long as the functions have existed. The problem is that the answer to what should this cost, at the granularity a modern cloud deployment demands, requires both questions to be answered simultaneously.
What lives in the gap
Several concrete categories of cost live in the gap between the two disciplines. Each is a real line item that neither discipline sees on its own.
Marketplace subscriptions billed at rates above corporate contracts. A team wants to use a licensed database product. They provision it through the cloud marketplace because that is the fastest path. The marketplace rate is thirty percent above the corporate contract rate that ITAM already negotiated for the same product a year ago. FinOps sees the higher rate on the bill and considers it normal because that is what the marketplace lists. ITAM sees the corporate contract but does not know a marketplace substitution exists.
BYOL entitlements sitting unused. The company owns entitlements from a legacy on-premises footprint. The workloads have been moved to cloud. The workloads are billing under marketplace rates or PAYG rates for the same software the company has already paid for. The BYOL substitution would be straightforward if anyone knew both sides of the picture.
Per-user license models applied to per-instance cloud workloads. Some licensed products bill per named user in traditional deployments. In cloud the same products often bill per instance, per hour, or per some other unit that does not map cleanly. When the mapping was set at initial deployment, either the finance team accepted the cloud model without checking the corporate rate, or the corporate rate was applied but the mapping was never revisited as the workload scaled. Either way the effective rate drifts.
Compliance obligations paid but not needed. Contracted tiers persist through renewals because the renewal process is easier when no one questions the tier. A tier that was needed for a workload that has been retired continues to be paid for. A tier that was needed to cover a peak that is now smoothed out by autoscaling continues to be paid for.
Product substitution opportunities. A workload uses a licensed product because it was chosen five years ago. Cloud-native equivalents exist today at a fraction of the cost. The FinOps team can spot the cost. The ITAM team can spot the contract. Neither on its own can spot that the workload could be re-platformed onto a cheaper substitute without disrupting the business.
Each of these categories individually is unlikely to be more than a few percent of the total bill. Together across a mature deployment they accumulate to the double-digit percentage of the cloud bill that industry benchmarks report as recoverable through joint FinOps-plus-ITAM work.
Why single-discipline tools miss it
A single FinOps tool cannot close the gap because the tool's data model does not include the entitlement side. The FinOps tool reads FOCUS-normalized billing. It can distinguish a workload's cost by service, by resource, by tag, and by usage type. It cannot look up whether the workload's software cost is being charged at the corporate rate or at a marketplace rate the company could substitute out of. It cannot check whether the workload is drawing from a contracted entitlement or paying twice for the same software. It cannot compute the delta between the paid rate and the effective corporate rate because it does not know what the corporate rate is.
A single ITAM tool cannot close the gap for the mirror-image reason. The ITAM tool holds contracts and entitlements. It does not see per-hour or per-request utilization of specific workloads in specific cloud accounts. It cannot check whether an entitlement is over-provisioned by a factor of ten because the peak workload it was sized for has been retired. It cannot verify that a workload approaching a license ceiling is generating a compliance exposure right now. It cannot compare marketplace charges billed through the cloud accounts to the corporate rate on the same product because the ITAM tool does not read the cloud bill.
The tools on both sides can each get to the join if they add the missing data. The FinOps tool that ingests entitlement data closes the gap from one direction. The ITAM tool that ingests billing data closes it from the other. Historically both sides have been slow to add the other side's data because the data owner is a different team with a different vendor relationship and a different data governance model. The join is more of an organizational project than a technical one, which is why it takes years even after the value is documented.
The join
The join between billing and entitlement is a three-table data model with a single canonical join key.
The billing table is the FOCUS-normalized view of every cloud resource this month. Cost, quantity, product identifier, workload identifier, team, and business unit. This is table stakes for any FinOps practice.
The entitlement table is the ITAM system's view of every software contract in force. Contracted volume, per-unit rate, coverage window, product identifier, and the internal owner of the contract. This is table stakes for any ITAM practice.
The mapping table is the cross-reference between cloud-provider product identifiers and ITAM product identifiers. The cloud provider calls it one thing on the bill. The ITAM system calls it a slightly different thing in the contract. The mapping table is the reconciliation and it has to be built by hand the first time. Once it exists, the mapping table is a slowly changing dimension that requires periodic maintenance but does not require ongoing work per query.
With those three tables in a single queryable store, the joined view answers the questions that neither discipline can answer alone. For every workload, what is the effective rate we are paying, and how does it compare to the corporate rate. For every entitlement, what is the actual utilization rate against the contracted volume. For every product with both a marketplace rate and a corporate rate visible in the data, what is the blended effective rate across the deployment, and where are the outlier workloads that are furthest from the corporate rate.
The build cost of the joined view is dominated by the mapping table. Once the mapping table exists, the joined queries are ordinary SQL and any FinOps analyst can run them.
The thirty minute audit
The audit that surfaces exposure in this category takes about thirty minutes if the joined data model is already in place. If the data model does not exist yet, the audit is longer because it requires the mapping table build first.
Coverage check. For every licensed product deployed in cloud, is there a mapping row that connects the billed line item to an entitlement, or an explicit note that no entitlement applies. Any product with a billed cost and no mapping row is a finding.
Duplication check. For every product with a corporate contract, are any workloads billing through marketplace rates for the same product. Any duplicate payment path is a finding worth reviewing on the same day.
Utilization check. For every entitlement, what fraction is actually consumed by cloud workloads this month. Entitlements below sixty percent utilization are candidates for renegotiation at the next renewal. Entitlements below twenty percent are candidates for immediate reduction.
Exposure check. For every workload using a licensed product, does the license count cover observed utilization with reasonable margin. Workloads under license coverage are compliance findings that go to a different priority queue than cost findings.
Rate check. For every product with both a corporate rate and a marketplace rate visible in the data, what is the delta between the two and how much of the billed volume is at the higher rate. Rate gaps above ten percent are findings for the procurement conversation.
Findings from the five checks form the joint roadmap. The engineering priority order tends to sort itself: duplication findings first because they are the fastest wins and the easiest to close, exposure findings second because they are compliance risk, rate findings third because they need procurement calendar time, utilization findings fourth because they wait for renewal windows, and coverage findings fifth because they represent the ongoing data model maintenance the whole practice depends on.
Where this fits Brain Agents AI
Brain Agents AI is building multi-cloud AI cost intelligence for teams running production workloads across GCP and AWS. Join the beta waitlist for early access.