
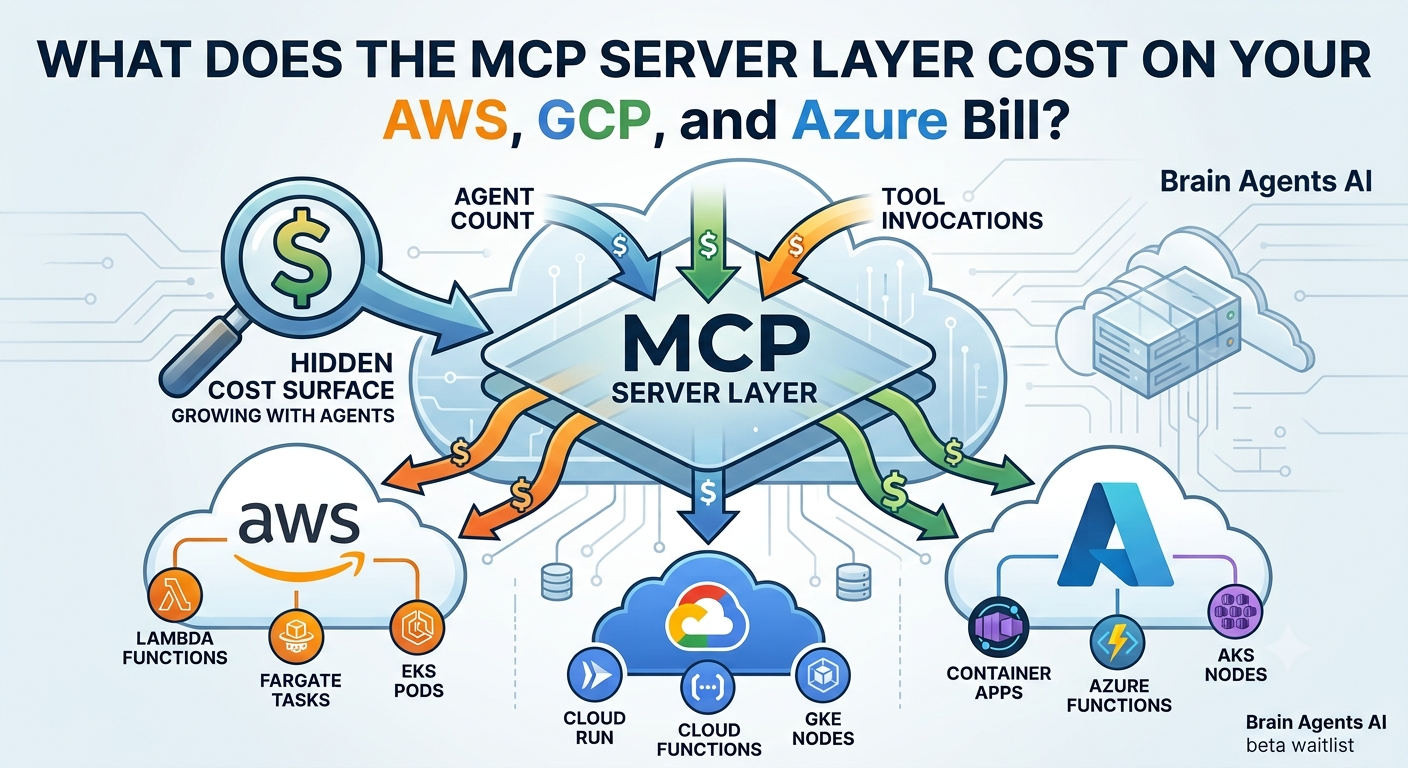
The MCP server layer creates a new cost surface that hides inside your compute bill and grows as agent count grows. This article walks through where the layer sits, why it stays invisible on standard cost dashboards, how to measure it, and what the audit that surfaces the exposure looks like. The answer, front-loaded so you can decide whether to keep reading, is that MCP cost bills as generic compute, storage, and network under whatever workload identity the MCP server runs under. To make it visible you need three signals: a request identifier propagated through every call, a server identifier attached to every invocation, and a cost tag on the underlying infrastructure. With those three, the MCP layer becomes a first-class line item you can measure per action, per agent, and per cloud. Without them, the layer keeps growing quietly while finance and engineering both look at the wrong dashboards.
The reason this cost surface warrants an article of its own is that most FinOps discipline was calibrated for a workload class where the cost model is one line item per resource and the resource is stable across the month. MCP servers do not fit that shape. They are ephemeral, they multiply with agent behavior rather than user activity, they distribute across every cloud service capable of hosting a lightweight runtime, and they run under whichever identity the engineering team happened to use when they deployed the first prototype. By the time the deployment is real, the cost is already large and already invisible. The audit that surfaces the exposure is one of the fastest wins available to teams building agentic AI in production, and it does not require any new tooling to run.
Where the MCP layer sits
The Model Context Protocol is a specification that lets an agent runtime call out to tools, data sources, and side-effecting services in a structured way. The agent framework knows how to speak the protocol. Any server that implements the protocol becomes a tool the agent can invoke. That server is the MCP server layer. It is not a single service. It is a class of services, one per capability the agents in the fleet need to reach.
The layer is deployed in whatever way the engineering team finds convenient. A stateless tool that formats JSON or hits a public API works well as a Lambda function or a Cloud Run instance. A stateful tool that maintains an index or a session runs as a long-lived container on ECS, GKE, or Azure Container Apps. A tool that mediates access to a database runs adjacent to the database, sometimes as a sidecar. A tool that authenticates the agent against a corporate identity provider runs behind an API gateway. Each of these deployment shapes creates a different cost profile, and the fleet ends up spanning several of them at once.
The important structural point is that none of these deployment shapes is named MCP on the cloud bill. The Lambda functions look like Lambda functions. The Cloud Run services look like Cloud Run services. The API gateway looks like an API gateway. The cost of the MCP layer is the sum across all of these, and the cloud bill has no built-in way to compute that sum unless the underlying resources carry tags that identify them as MCP infrastructure.
Why the layer stays invisible
Three structural reasons keep the MCP layer invisible on standard cost dashboards.
The first reason is naming. The bill categorizes cost by service (Lambda, Cloud Run, Kubernetes) rather than by workload role (MCP server, model inference proxy, front-end API). A dashboard that groups by service will show the MCP servers spread across every compute category and none of them will stand out. A dashboard that filters by workload role can only do that if the underlying tags exist. Most teams building agentic AI reach the size where MCP cost matters before they add the tags.
The second reason is behavior. Cost dashboards are built to show user-driven cost curves. A workload with a thousand users doing one thing per hour looks like a smooth line that scales with user count. The MCP layer does not behave that way. Its cost scales with tool-call fanout per user action, which is a variable the engineering team controls through prompt design and tool catalog choices. Fanout can change by ten times without a matching change in user count. A dashboard that expects user-driven curves reads that shift as noise. A dashboard built for agent-driven cost reads it as a leading indicator.
The third reason is the identity boundary. MCP servers often run under whichever service account or IAM role was convenient when the first prototype shipped. Different servers run under different identities. Cross-account cost consolidation, where it exists, does not by default group by workload role. Even when the tags are correct on the servers themselves, the cost dashboard that reads across accounts may lose the workload label unless the FinOps pipeline is explicitly configured to preserve it. This is a solvable problem, but solving it requires a deliberate pass across the fleet, and the pass is rarely on anyone's roadmap until the invisibility becomes a cost surprise.
Where MCP cost lives, by cloud
The specific line items that add up to MCP cost vary by cloud, but the shape is consistent. In each cloud there is a compute cost, a storage cost, and a network cost, and each of them contributes.
On AWS the compute cost is Lambda invocations for stateless servers, Fargate task-seconds for containerized servers, EKS pod hours for long-running servers, and API Gateway request counts for the layer in front of them. The storage cost is S3 for cached tool payloads and DynamoDB for session state. The network cost is data processed by ALB or API Gateway and egress bytes when tool calls reach external APIs. Each of these line items lives under a service name that does not mention MCP. Attribution requires cost allocation tags on every resource that participates.
On GCP the compute cost is Cloud Run request seconds for containerized servers, Cloud Functions invocations for stateless functions, GKE node hours for long-running servers, and API Gateway calls. The storage cost is Cloud Storage for cached payloads and Firestore or Cloud SQL for session state. The network cost is load balancer forwarding rules and network egress. GCP labels serve the same function as AWS cost allocation tags for the attribution step.
On Azure the compute cost is Azure Functions invocations, Azure Container Apps request-seconds, AKS node hours, and API Management transaction counts. The storage cost is Blob Storage and Cosmos DB or Azure SQL. The network cost is Application Gateway and outbound data transfer. Azure resource tags, applied at deployment time, close the attribution loop.
The multi-cloud version of the question, which is what does the MCP layer cost across all three clouds this month, is answerable only if the tag or label scheme is coherent across all three. A tag named workload-role with a value of mcp-server on AWS, GCP, and Azure resources is the minimum coherent scheme. A tag scheme that varies by cloud produces a cost figure per cloud but no cross-cloud total.
What to measure and how
Three measurements make the MCP layer manageable. Each one requires instrumentation the engineering team can add without vendor tooling, and each one answers a specific question that finance and engineering have to agree on.
The first measurement is total MCP cost by cloud, by month. This is the number that goes on a leadership slide. The measurement comes from summing every tagged resource across the compute, storage, and network categories, in each cloud, for the month. The instrumentation is the tag scheme on the resources and a cost query that groups by the tag.
The second measurement is cost per action. This is the number that guides prompt design and tool catalog decisions. The measurement comes from grouping MCP invocations by a request identifier propagated from the user action, summing the compute and storage cost across all invocations for the request, and averaging over a representative sample of actions. The instrumentation is a request identifier in the MCP call headers, a log emitter on every server, and a cost model that maps invocation counts to unit cost.
The third measurement is cost per agent. This is the number that guides scaling and budgeting decisions per team or per product surface. The measurement comes from grouping MCP invocations by an agent identifier and summing the same way as cost per action. The instrumentation is an agent identifier in the MCP call auth context and the same log emitter and cost model as above.
None of these three measurements require a new tool. They require deciding what to measure and instrumenting the layer to emit the signals. The engineering team can add the signals in a sprint. What tends to stall the effort is not the technical work but the agreement on which fields are canonical, who owns propagating them, and where the cost model lives. Getting those agreements is the leadership contribution to the audit.
The audit
The audit is a walk through five checks. Each check either passes or produces a finding. The findings are the roadmap.
Inventory check. List every MCP server running today, in every cloud, for every agent fleet. The list should include the deployment shape (Lambda, Cloud Run, container), the identity it runs under, and the tools it exposes. If the list takes more than an hour to produce, the fleet is already large enough that undocumented servers are running somewhere.
Tagging check. Verify that every server on the list carries a tag or label that identifies it as MCP infrastructure and a sub-tag that identifies the agent or fleet it serves. If any server is missing the tag, the cost of that server is invisible in every downstream measurement. This is the fix with the highest ratio of value to effort.
Invocation counting check. Every server should log the request identifier, the agent identifier, and the tool invoked on every call. The logs should land in a queryable store within minutes. If the logs are missing any of the three fields, the cost-per-action and cost-per-agent measurements degrade to guesses. If the logs land in a store that takes hours to query, the cost signal lags behind the behavior that produces it.
Cost projection check. Project the monthly cost by summing the average unit cost of each server class times the monthly invocation count. Compare the projection to the actual compute bill under the MCP tag. Gaps are the finding. A projection that undershoots by more than twenty percent means either the invocation counting is undercounting, the unit cost is wrong for the server class, or some servers are missing the tag and their cost is leaking into a different bucket.
Per-action rehearsal check. Pick five representative user actions. Trace the MCP invocations through the logs for each. Sum the cost. Ask the team owning each action whether the number matches their intuition. The gap between the number and the intuition is the finding, and this check often surfaces the most useful engineering insights because it forces engineers to see specific numbers rather than aggregate curves.
An audit that passes all five checks means the MCP layer is a first-class citizen in the FinOps practice. An audit that fails on the tagging check is not yet ready for the other four; fix the tags first, run the other checks second.
Where this fits Brain Agents AI
Brain Agents AI is building multi-cloud AI cost intelligence for teams running production workloads across GCP and AWS. Join the beta waitlist for early access.